
It is quite an age we live in where nearly every activity we partake in can be tracked via electronic devices using metrics such as distance, pace, heart rate, power… the list goes on. Viewing the data for a single activity can provide invaluable information on training and racing, but it is once you have a collection of data from a few months or several years that things begin to really take shape. Looking at data over time can give you insight into the gains that an athlete has made over the season and show what is working and possibly what needs to be adapted.
With the TrainingPeaks Dashboard, you can add charts with custom date ranges and titles, allowing you to look at the data from different angles. Below are some of my favorite charts, how they function, and why I find them valuable.
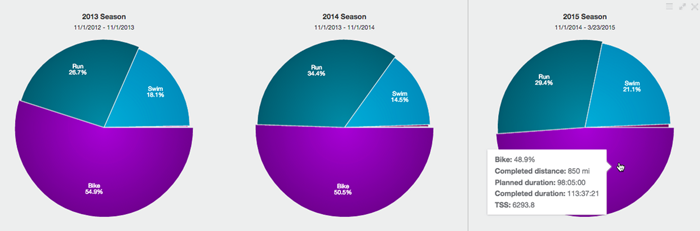
1. Fitness Summary Chart
First up is the Fitness Summary chart. I like to have one of these set up for the completed duration for each of the last two seasons and the current season. This gives me a macro view of how a multisport athlete has been distributing their training time from one season to the next. If an athlete had a weakness in one sport I might want to see a shift of training time from the strongest sport to the weakest sport as we try to address those limiters. By hovering over the chart I can also see information such as completed distance, planned duration, and Training Stress Score.
2. Fitness History Chart
Next up, we have the Fitness History chart. Here, I like to have one for peak power for the bike and another for peak pace by distance for running. The Fitness History chart will show the peaks at different durations or distances for each of the last four weeks and for the last twelve months. This chart is a great way to view progress over time. Depending on what events the athlete is training for, you can easily see if they are getting faster or producing more power at the necessary durations for their goal event.

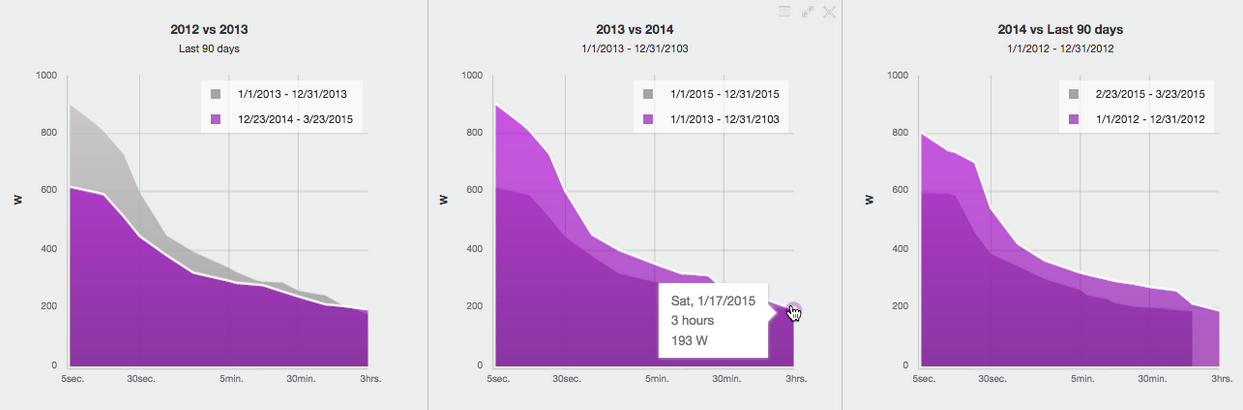
3. Peak Power and/or Peak Pace Chart
Another great chart for viewing progress over time is the Peak Power or Pace chart. This chart can be configured to compare two different date ranges. The three charts below compare one season’s data to the next. This chart can be used to compare any period of time you want. In the interest of having the most accurate data possible, this chart can also help to identify outliers. If you happen to spot a power, pace, or heart rate spike click on it to bring up the workout and then fix it or edit it with the correct tool.
4. Time In Zones Chart
To get an overview of if your athletes are hitting their workouts in the zones you’ve set, use the Time in Zones chart. It can be set to chart Heart Rate, Pace or Power, and the time frame you view can be customized. When trying to limit an athlete’s time above Zone 2 or targeting a certain energy system, the Time in Zones charts can be powerful allies.

5. Completed Distance and/or Duration Chart
If an athlete is having trouble hitting their target workouts week after week, the Completed Distance or Duration charts can be a helpful visual aid when talking to an athlete. The gray on this chart equals the planned duration, light colors are completed as planned, and the dark colors are completed over planned. Seeing this chart can help your athlete realize that they may need to reevaluate their goals if they continue to miss workouts. It can also be used to give an athlete confidence that they have done a solid amount of work.

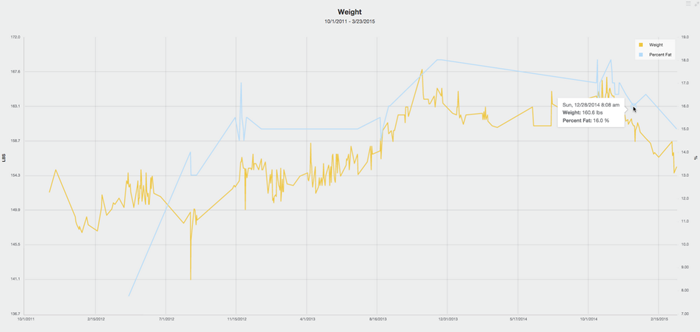
6. Metrics
While we all love data and numbers, sometimes it is the things happening outside of training in an athlete’s life that may be affecting their performance or compromising their recovery. There are many available metrics that can be tracked via the athlete’s calendar. These metrics can then be plotted against one another and charted in the dashboard. Some common combinations include: sleep hours and sleep quality, weight and body fat percentage, soreness and fatigue… the combinations are endless.
7. Performance Manager Chart
Last, but definitely not least, is the Performance Manager Chart (PMC). This chart combines frequency, intensity, and duration to give you a picture of the athlete’s Fitness, Fatigue, and Form. The PMC helps to tell a story of an athlete’s season and allows the coach to visualize when they are fit, when they may need some rest, and when they are ready to race. Furthermore, by entering a Training Stress Score® (TSS®) into planned workouts a coach can forecast this information into the future to try to target the perfect taper. Multisport coaches may wish to have a PMC setup for each sport type to see how each individual sport is contributing to the athlete’s overall fitness, fatigue, and form. We like to say that fitness minus fatigue equals form.

There are many ways to set up your Dashboard. You can add multiples of the same chart and customize based on sport type, date range, or metric. Clicking the menu icon will allow you to change the settings to view charts in multiple ways. There are many more available, find what works for you.
No single chart will tell you everything you need to know, but by examining the data from multiple angles you will begin to see a more complete picture of the athlete’s history allowing you to make educated decisions when it comes to planning and racing.
Attend TrainingPeaks University to learn how to use TrainingPeaks to work more efficiently.
